In this issue:
The ability to rapidly and accurately discriminate between health and malignant tissue offers surgeons a tool for in vivo analysis that can potentially reduce operating time, and facilitate quicker recuperation and improve overall patient outcomes. The team investigate discrimination between diseased tissue and adjacent healthy controls from patients with head and neck cancer using near-infrared Raman Spectroscopy. The results indicate previously unreported peaks in the Raman spectra that lie outside the conventional “fingerprint” region (400 cm−1–1800 cm−1) played an important role in our analysis and in discriminating between the tissue classes. Preliminary multivariate statistical analyses of the Raman spectra indicate that discrimination between diseased and healthy tissue is possible based on these peaks. The ability to rapidly and accurately discriminate between health and malignant tissue offers surgeons a tool for in vivo analysis that can potentially reduce operating time, and facilitate quicker recuperation and improve overall patient outcomes. The team investigate discrimination between diseased tissue and adjacent healthy controls from patients with head and neck cancer using near-infrared Raman Spectroscopy. The results indicate previously unreported peaks in the Raman spectra that lie outside the conventional “fingerprint” region (400 cm−1–1800 cm−1) played an important role in our analysis and in discriminating between the tissue classes. Preliminary multivariate statistical analyses of the Raman spectra indicate that discrimination between diseased and healthy tissue is possible based on these peaks.
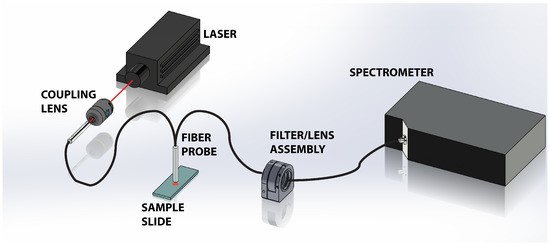
Figure 1 shows a schematic of the experimental apparatus. A 300 mW, 785 nm near-infrared laser from Laserglow is used to illuminate the tissue sample. To prevent saturation of the spectrometer with strong residual Rayleigh signal, the beam was attenuated and coupled into a multimode optical fiber reflection through a 10× objective. The attenuation and coupling losses resulted in approximately 1 mW of power emerging from the fiber probe. The probe, comprised of a read out core surrounded by a ring of 200 μm diameter core illumination fiber, was positioned approximately 1 mm above the sample. The divergence of the light emanating from the probe illuminates the tissue sample with a spot that is approximately 700 μm on the tissue, which is a significant fraction of the tissues under study. This results in spatial averaging of the Raman scattering signal collected by the probe. The scattered light is collected via the central read fiber and is transmitted through the second leg of the probe to the filter assembly. The emerging light enters the filter/lens assembly where it is collimated and passes through a 785 nm Raman edge filter which is designed to block the laser and elastic scattering while transmitting light greater than 792.5 nm. The filtered light is then focused back into an optical fiber and directed to a Maya Pro 2000 NIR spectrometer (Ocean Optics). The light is then dispersed across the detector and recorded to a computer for further analysis.
Results From The Study
Results from this study indicate that although the majority of the spectral signatures are nearly identical in our cancerous tissue and healthy controls, there are several peaks, including several previously unreported peaks in the 130–400 cm−1 Raman shift region, which proved useful in differentiating between the healthy and malignant samples. In addition, the team observed systematic intensity differences among the spectra, where the intensity of the Raman signal (peaks + baseline) in the cancerous samples are identifiably higher than their corresponding control.
Full access to the materials and methodology, can be found by
clicking here.
Details on the Laser used in the research can be found by
clicking here.